Basic Excel Skills Employers Want and How to Get Them
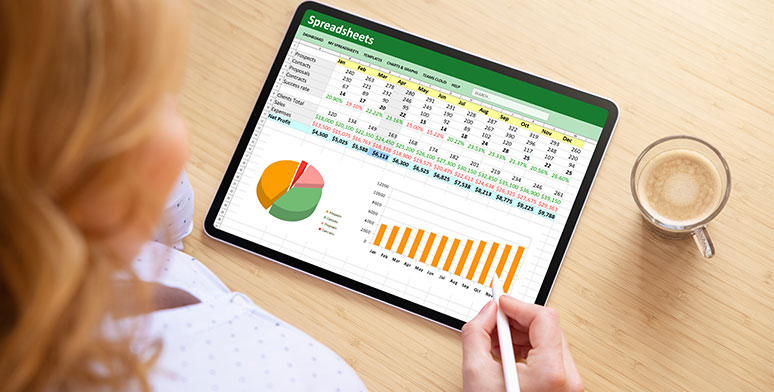
Microsoft Excel is one of the most widely used applications in the business world. It is an essential tool for organizing and analyzing data, and being proficient in its use is a necessary skill for many jobs. Perhaps, even more importantly, employers are looking for problem solvers and organized leaders. Basic Excel competence signifies that you have invested in the tools to bring both job specific and these “soft” skills to your performance.
So, what counts as “Basic Excel Skills”? The following is a list of fundamentals to support many useful tasks.
Learn the Excel Ribbon
The ribbon is your road map to all the tools and features Excel has to offer and the signature user interface of all Microsoft Office applications. Its genius is that you don’t have to know where every command is located, you just need to have a good general sense of how the categories of commands are grouped. You might not have ever noticed the Subtotal command, but if you recognize that applying a Subtotal is going to perform an action on your Data, you should quickly think to look for it on the Data tab, for example.
Study what kinds of commands are located on each tab and quiz yourself to find ones you are using or learning about.
Master Entering Data
Entering data is a fundamental skill in Excel, which is obvious and nothing to sneeze at. Getting the hang of how cells, columns and rows work and interact can take some practice. And once you are comfortable selecting cells and typing or copy/pasting data into them, you will quickly become aware of how much more there is to prepare useful spreadsheets such as:
- Layout – How you organize your rows and columns of information directly impacts how easy it will be to add calculations. Certain kinds of analysis, such as PivotTables and charts, will also require specific data layouts.
- Data types – Each cell must be set to the correct data types so that when you begin analysis, you are comparing apples to apples…or numbers to numbers and dates to dates, for example.
- AutoFill – Shortcuts such as AutoFill and FlashFill aren’t just helpful tricks, they are essential tools for entering data correctly and efficiently.
Practice by preparing several worksheets to solve specific tasks. Pay attention, then, to how your data layout impacts your calculations and practice using AutoFill to complete them as efficiently as possible. Solving real problems, even simple ones, will shake out the basics you need to learn to complete the task.
SAVE $10 AND TRAIN ON THIS TOPIC TODAY
Understand Formulas and Functions
Formulas and functions are the backbone of Excel but can also be the most difficult notion to wrap your head around. It simply takes some practice to begin thinking about calculations in terms of cells, functions and arguments.
Begin by creating a simple formula, such as adding two rows or two columns of numbers. Use AutoFill to see how Excel adjusts formulas as they populate across the spreadsheet. Then, apply a more complicated formula that adds additional calculations. Until you trust yourself, practice with calculations you can confirm in your head or with a calculator to catch and correct formula writing bugs.
Finally, repeat the above for the most common functions including SUM, AVERAGE, COUNT, MAX and MIN. Make sure to know the functions common in your area of work such as Text functions if you work with a lot of text data, or date functions if you handle a lot of time-sensitive data.
Sort and Filter Data
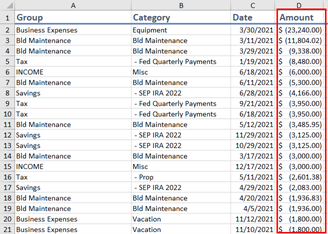
Sorting and filtering is essential for viewing and understanding large sets of data. Open a large spreadsheet, one with multiple columns and many rows. Then, use sort and filter techniques to answer specific questions. Example A <image 03.png> shows a transaction report sorted by the Amount column. This can answer the question “what were my most expensive transactions this year?”
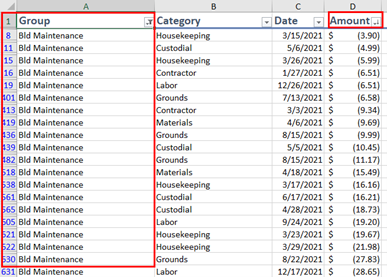
Example B <image 02.png> shows the same file that is filtered to answer the question “what did I spend on Building Maintenance this year?” This sheet is filtered to show only the Bld Maintenance group and is then sorted by amount.
Starting with a question you want answered is the best way to learn and understand how Excel’s tools and features work.
Create Charts
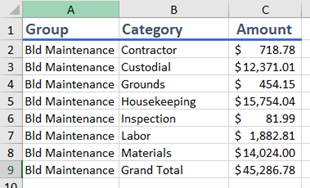
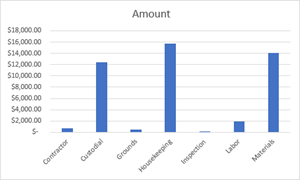
Charts are a great way to visualize data that is otherwise difficult to interpret. Graphics can, in fact, be the most important step between gathering data and understanding it. As before, start with a set of data to practice on, then use charts to answer specific questions. This example builds on our previous data and answers the question “What am I spending the most on in Building Maintenance?”
Print and Share Workbooks
Finally, you should know how to print and share your Excel files. Unlike word processing tools that always have printouts in mind, Excel prioritizes onscreen analysis instead of paper. Printing can be confusing and cumbersome to pull off.
Practice with medium size spreadsheets – not too big, but large enough for at least two or three sheets of paper. Adjust print area, page orientation, margins and scaling settings to produce readable, pleasing printed versions of your data.
And assume that you will regularly share workbook files with others. Save an example file into several file formats and make sure you know when and why you would use each one.
In Summary
Mastering Basic Excel skills is all about being confident enough to learn the next thing you need to know. Build a solid foundation from the above list, and you’ll be able to claim Basic Excel Skills as a resume item and demonstrate the ability to learn whatever job specific tasks your employer throws your way.
If you need additional help reaching this level of confidence, or if you simply learn better in a guided setting, Pryor Learning has many Excel courses at all levels to get you there.
