Create a 3-D Power Map in Excel
Microsoft’s latest release of Excel has some powerful updates. Our latest 2016 highlight is the popular Power Map add-in. This feature can plot geographic and temporal data on a globe or custom map in a three-dimensional presentation. You can view data changing over time and create animated presentations called “tours”.
Imagine you’re creating a presentation that discusses demographics, say crime rates around the U.S. You want to show regional differences in the statistics, but bar charts don’t clearly communicate where – geographically – the data is from. Bar charts don’t create the impact you were hoping for.
The Steps
Create a 3D Map
- Prepare your data:
- You must have at least one geographic value in each row of data. This could be City, Country, Region, Zip, State, Address or Latitude/Longitude data.
- Format your data into an Excel Table.
- Click any cell in the table, then click the 3D Map button [A] in the Tours group on the Insert tab.
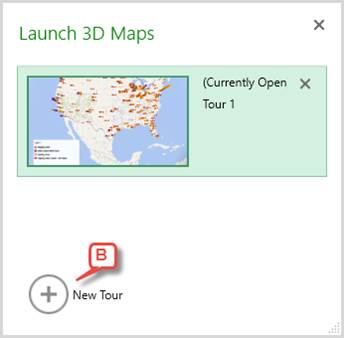
- Click New Tour [B]. If you are using 3D Maps for the first time, you may have to Enable the Data Analysis add-in to use the feature [C].

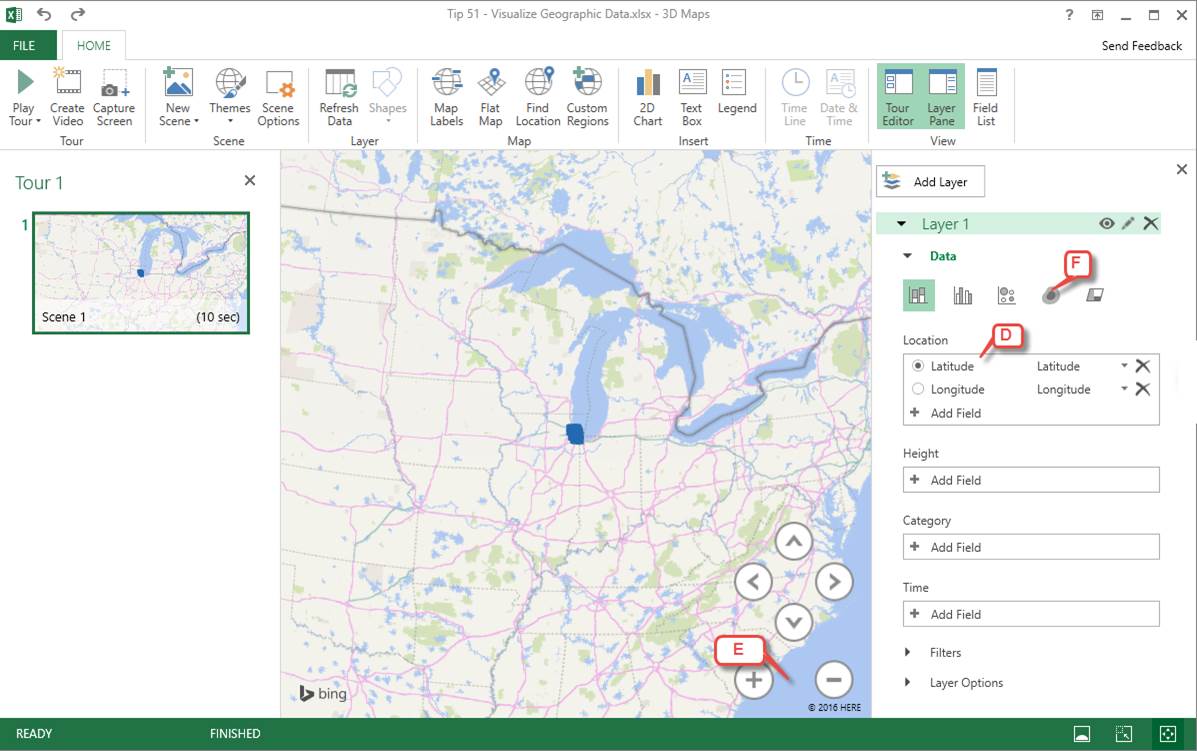
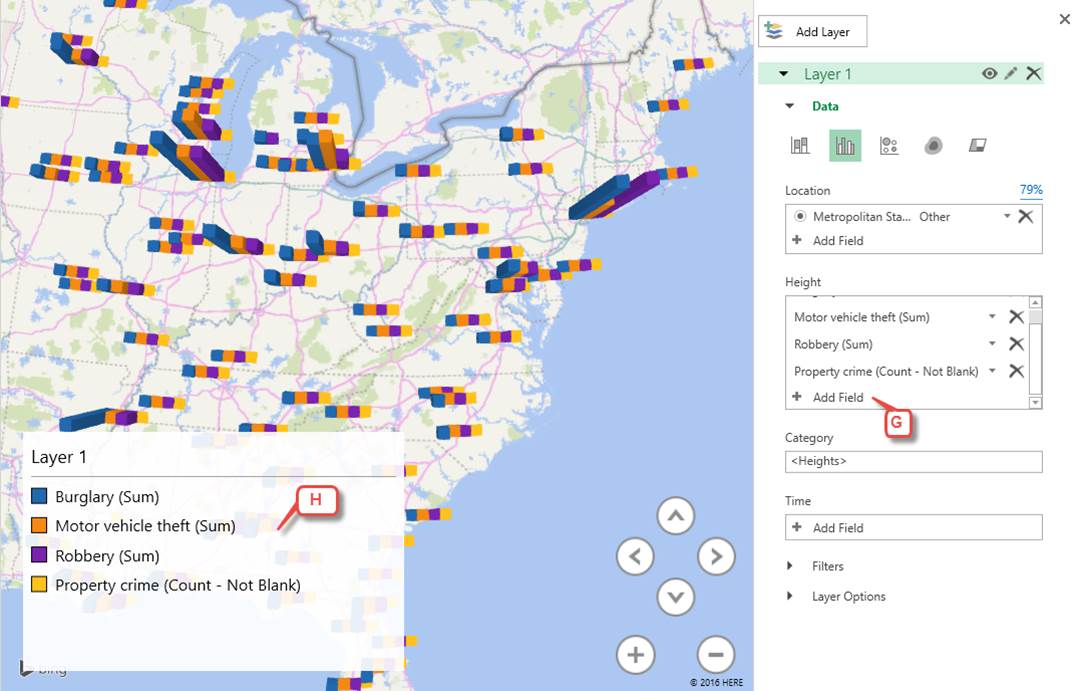
- A new 3D maps window will open. Excel will attempt to identify the Location field from your worksheet [D]. If it does not, click Add Field and select the correct location column from the dropdown menu.
- Adjust the zoom [E] to best view your data. Too close and you will miss some data. Too far and the data can look too “crowded”.
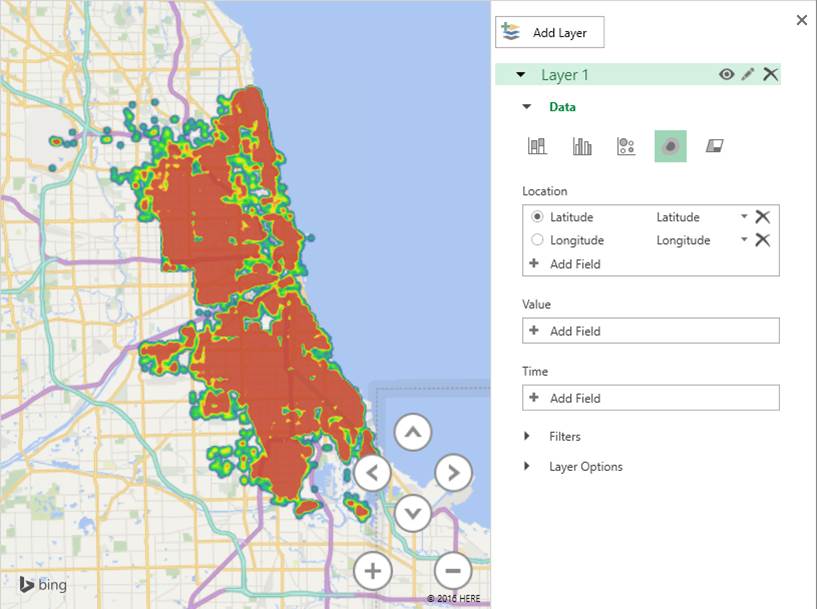
- Select the visualization type. If the default bar chart is not the right type for your data, choose from the row of types [F].
- If your data contains multiple values associated with each region, add those fields to the Values pane. Click Add Fields [G] and select from the dropdown menu. Excel will add the values to the map and create a legend [H].
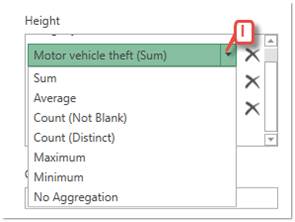
- Adjust data values by clicking on the arrow beside the field. Choose an option from the dropdown menu [I].
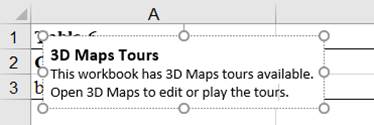
- When you have finished working in 3D Maps, click the File tab, then Close to return to your worksheet. A text box may appear to remind you that you have 3D content available.
Click here for example data used.
