How to Create a Report in Excel: The PivotTable
Excel is a powerful reporting tool, providing options for both basic and advanced users. One of the easiest ways to create a report in Excel is by using the PivotTable feature, which allows you to sort, group, and summarize your data simply by dragging and dropping fields.
First, Organize Your Data
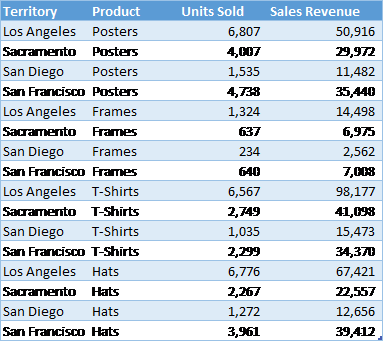
Record your data in rows and columns. For example, data for a report on sales by territory and product might look like this:
A PivotTable report works best when the source data have:
1. One record in each row;
2. One column for each category for sorting and grouping (such as “Territory” and “Product” in the example above; and
3. One column for each metric (such as “Units Sold” and “Sales Revenue” above). Recording some sales revenue in a different column complicates the task of adding up all of the sales revenue.
Create the PivotTable
Next, create the PivotTable report:
1. Highlight your data table.
2. From the Insert ribbon, click the PivotTable button.
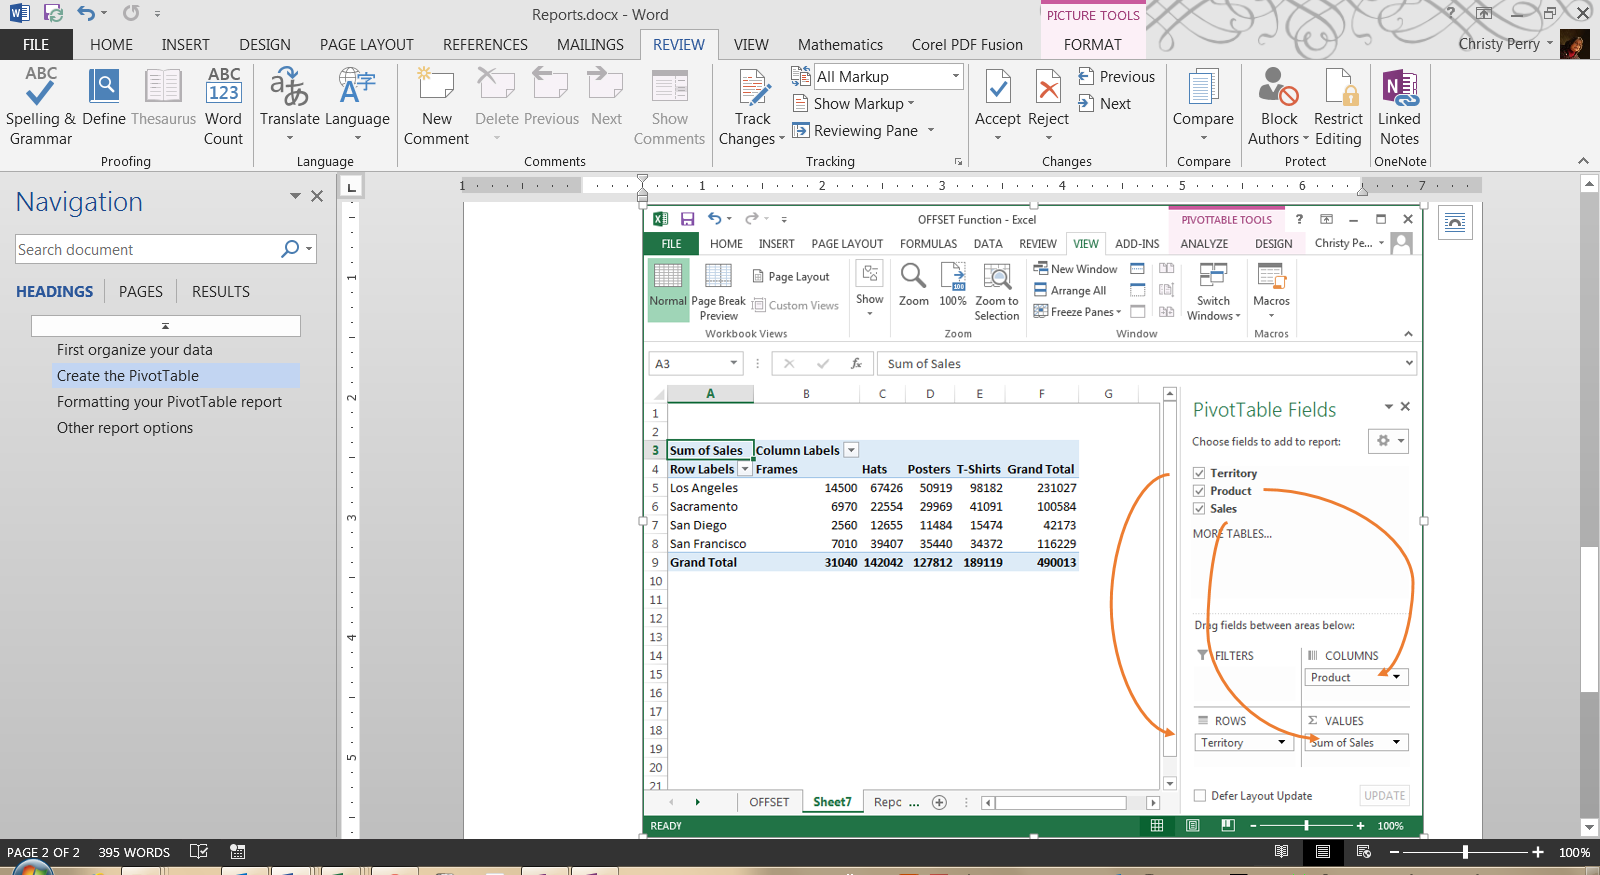
3. On the far right, select fields that you would like on the left-hand side of the report and drag them to the Rows box.
4. Also on the far right, select fields that you would like to appear across the top of the report and drag them to the Columns box.
5. Select the data that you would like to summarize and drag it to the Values box.
6. For each item under Values, specify how to aggregate the data—with a sum, average, or some other function. This is a great time-saving step!
With each change, you’ll see your PivotTable report take shape. If you decide you don’t like the layout, just drag the fields to other positions.
Formatting Your PivotTable Report
From the PivotTable Design ribbon, choose a style for your report based on your theme’s color schemes with options for header rows, header columns, totals, and subtotals. From the Home ribbon, set the number format for your data, or right-click your data, choose Value Field Settings, and click Number Format.
Other Report Options
Do you want even more flexibility in your reports? Do you ever need to, say, connect to data in an external database or create charts based on your reports? All of these options are available with PivotTables!
Or, if you need more flexibility than PivotTables provide, you can:
1. Create a freeform report by adding totals and subtotals directly to your source data,
2. Use the Group and Subtotal options on the new Outline section of the Data ribbon, or
3. If you’re using Excel 2013, use the new Quick Analysis button.
No matter which option you choose, Excel is one of the most flexible reporting tools available today!


