Excel 2013: How to Create a PivotTable from Multiple Sheets
Once you become a PivotTable fan, you will start to see lots of uses for this powerful analysis tool. But what can you do when the data you want to use is in separate tables in multiple sheets across your workbook?
Excel 2013 introduced a method – called the Data Model – that lets you assign relationships between tables and create PivotTables across multiple sheets.
The steps below will demonstrate how to create PivotTables using multiple sheets as a source of data and will apply only to Excel 2013 or later. Images in this article were taken using Excel 2013 on the Windows 7 OS. To follow using our example below, download How to Create a PivotTable from Multiple Sheets.xlsx
Step One: Set Up Your Data
Make sure all your data is in Named Tables. If possible, when working with multiple sheets, it is very helpful to have one column of information in each spreadsheet that is the same.
In our example, this repeating data is the “Invoice #” column and appears in all three sheets we will be working with.
A column of information that is consistent across all of your sheets is similar to a “primary key” in a database and will reduce errors (such as if the sheets become sorted differently).
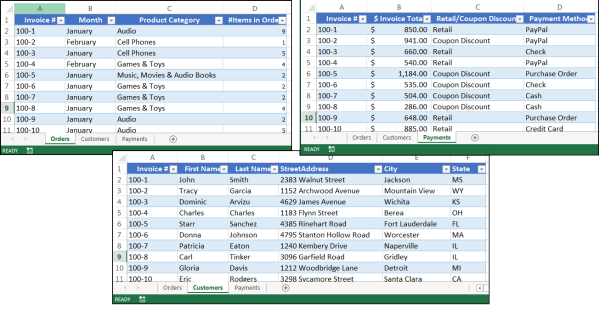
Hint! When specifying your table ranges, make sure you do not capture any extra empty rows or columns!
Step Two: Add Tables to your Data Model
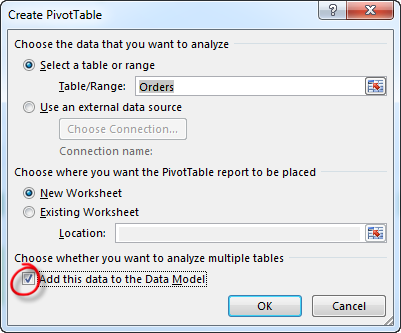
Begin creating your PivotTable by clicking anywhere in the named table on the first worksheet. In the example, you will click on the “Orders” table. Then click Insert > PivotTable to open the Create PivotTable dialog box:
- The Table/Range field should correctly include the Table’s Name “Orders”.
- The New Worksheet is selected so the new PivotTable will be placed in a new worksheet.
- Make sure Add this data to the Data Model is checked!
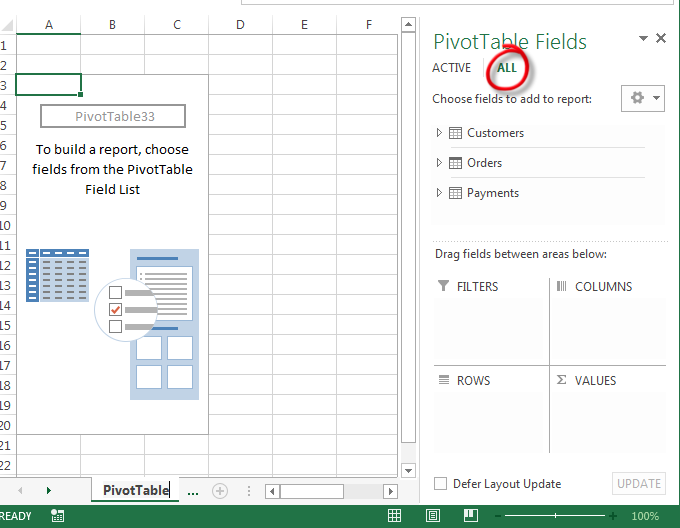
Click OK, and a new sheet will open with an empty PivotTable and the PivotTable Fields pane open. Click the All tab in the pane to see all the tables you have named in your workbook.
Step Three: Create Relationships Between Tables
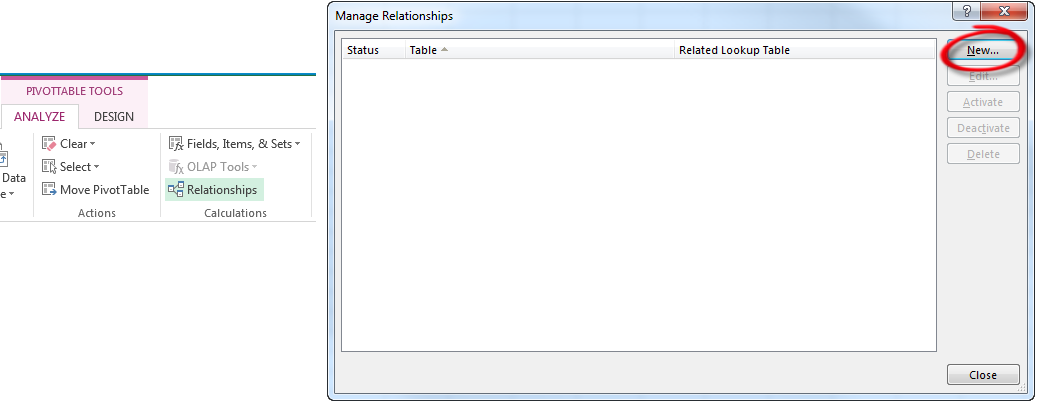
We now want to tell Excel which information is the same from table to table so our PivotTable can correctly associate the data between them. Click the Relationships button in the Calculations group on the Analyze contextual tab to open the Manage Relationships dialog box. Click the New button to specify a new relationships between your tables.
In the left pulldown menus, you will select two tables that have the same information. In the right pulldown menu, you will specify which columns are the same in those tables. In our example, “Invoice #” is the same in both the “Customers” table and the “Orders” table. Start by connecting the Payments Table to the Customers Table.
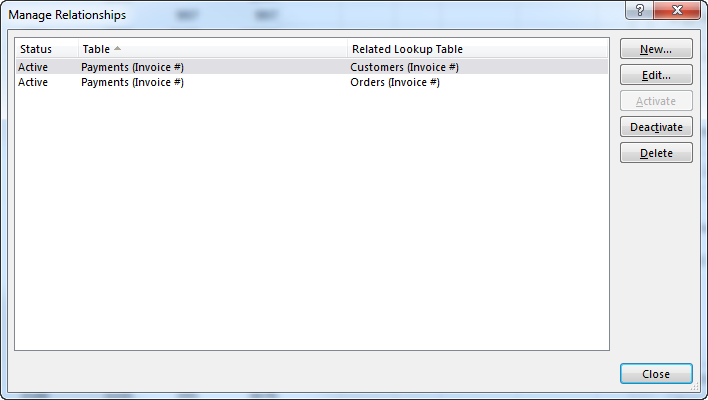
Since we have three tables we want to connect, you will repeat this step to connect “Payments to Orders” and your tables will be associated. Click OK.
Hint! This step is trickier than it seems! The order of relationships is very important. If the order is incorrect, then your resulting table will not calculate correctly. A “starting place” for how to order your relationships is to identify first what field you want in the Values Area of the PivotTable. Then select the table that contains that field first in the Create Relationship dialog box. If your tables offer more than one field (in different tables) that could appear in the Values Area, you may have to create a duplicate workbook and define a different order of relationships.
Because we want to Total the “Invoice Total” column in our PivotTable, we will put the “Payments” Table first. The “Manage Relationships” dialog box will look something like the below. Click Close.
Step Four: Create Your Table
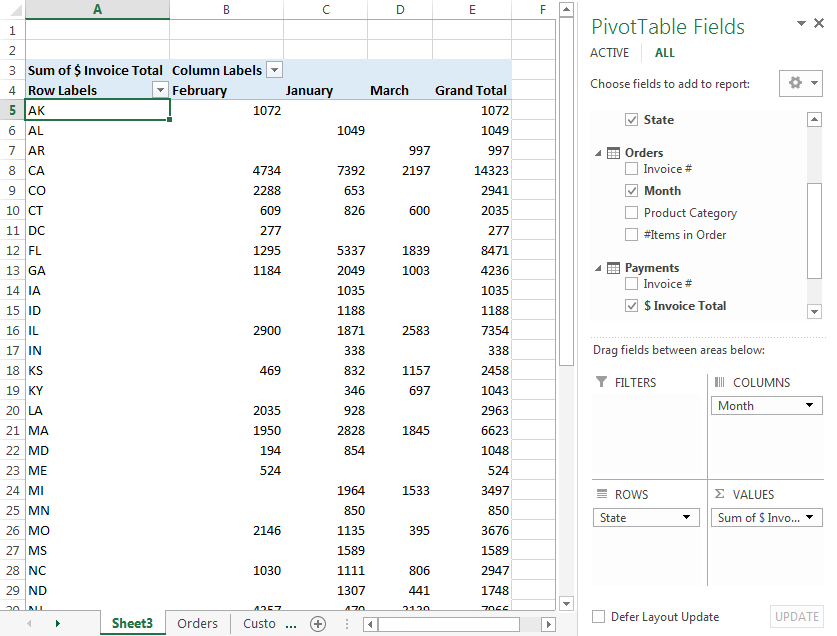
Now that all the fields from all your relevant tables are accounted for in the PivotTable Fields pane, you can create your PivotTable as you normally would. Our resulting PivotTable uses fields from all three tables and gives us a clear picture of how much is sold to each state during the months that were recorded.
This new feature in Excel 2013 adds a lot of convenience to what has been a laborious and cumbersome process in previous generations. That being said, it still has its hiccups (such as not being able to include two fields from different tables in the values area without adjusting relationships). For best results, spend time playing with and understanding how Relationship Order affects the outcome and you’ll be much closer to whipping out multi-sheet PivotTables like a pro.


