Export Excel Charts to Word and PowerPoint Using Copy/Paste
Once you have spent the time crunching numbers and creating a beautiful chart in Excel, you’ll probably find that you want to use it again and again in reports and presentations. Microsoft makes it easy to share objects between its Office programs, but few methods are easier than Copy/Paste. We are going to look at the ways to pull Excel charts into other Office documents using the Copy/Paste feature.
The techniques below apply to Office 2010 and later versions. The specific steps may vary slightly based on your version. Images were taken using Excel 2013 on Windows 7. To follow along with the examples, download Export Excel Charts.
Basic Copy/Paste
Begin by opening the Excel workbook that contains the chart you wish to use and the PowerPoint or Word document where you want it to go. Select the outside border of the chart and hit CTRL+C. Then, place your cursor in the new document and hit CTRL+V. The chart will appear in the destination document, and you can edit the chart just as if it had been created in Word or PowerPoint originally.
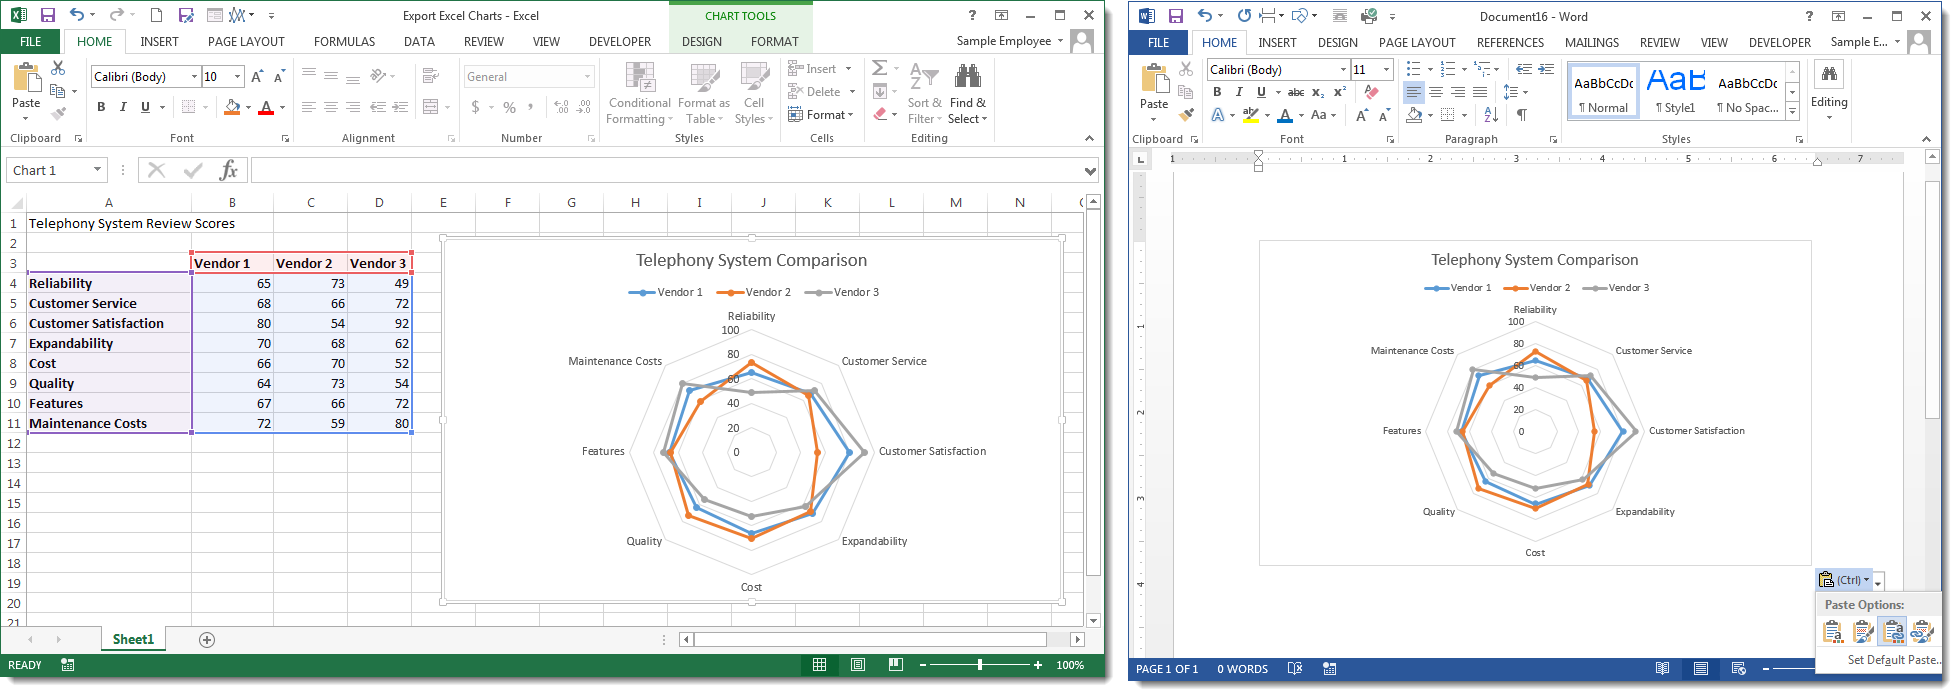
Additionally, this method creates a link to the original spreadsheet by default. If you update the data in the source Excel spreadsheet, the changes will be reflected in the destination (Word or PowerPoint) document the next time it is opened. You can also manually refresh the chart in the destination document by clicking the Refresh Data button on the Design tab under the Chart Tools contextual tab when the chart is selected.
In Office 2013, you can also edit the Data directly from Word or PowerPoint by clicking the Edit Data button. This will open a mini Excel window that will allow you to change the spreadsheet. Note that changes made this way will also affect the original saved spreadsheet! If you want to edit the spreadsheet in Excel, click the Edit Data dropdown arrow and select Edit Data in Excel. (In Office 2010, clicking Edit Data will always open the source spreadsheet in Excel).
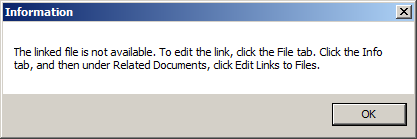
Caution! Because this method creates a link to a specific Excel spreadsheet, if you move or delete the source document or email the destination document to someone else, you won’t be able to update the chart.
Paste as Picture
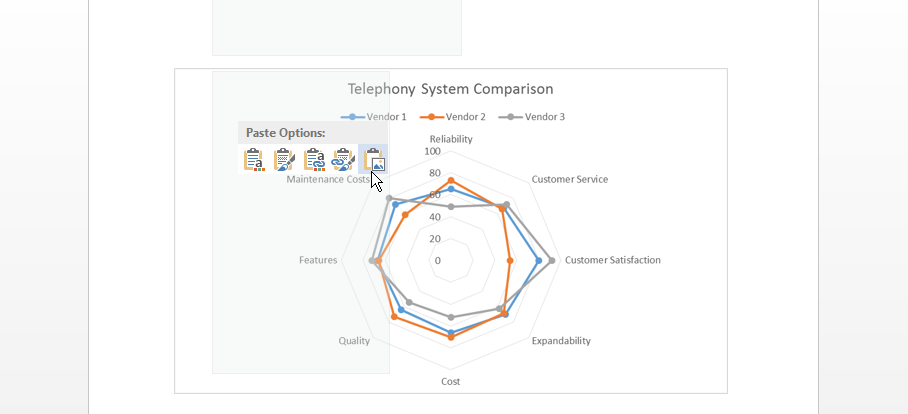
If you don’t need to regularly update your chart, you can paste the chart as a picture which automatically turns the chart into an image when it’s placed in the destination document. Place your cursor in the spot where the chart will go and right-click. Select Picture (U) from the fly-out menu under the Paste Options: heading.
You can then edit the image like any other, but you will not be able to change or open the source data or change the chart. Notice that the colors and text formatting will appear exactly as it does in the source chart. If you wish to make a chart that matches your destination theme’s colors and fonts, you will need to make those changes in the Excel spreadsheet first.
Paste Special
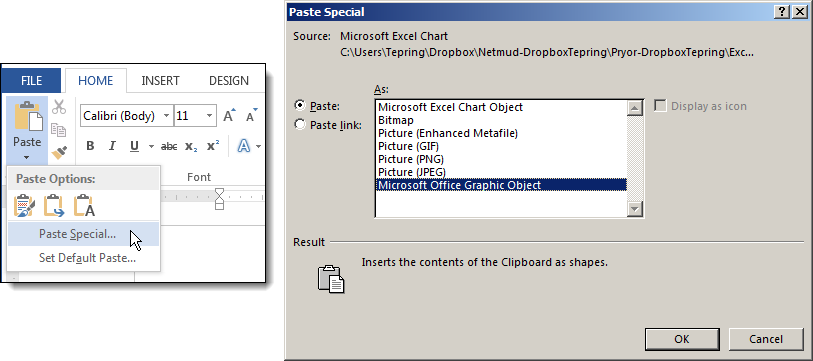
If you have specific requirements for how you want a chart image to appear in your document, place your cursor where the chart will go, then click the dropdown arrow on the Paste button. Select Paste Special to open the dialog box. From there you can choose what kind of image your chart should be pasted as, such as PNG or GIF file.
Choose Formatting
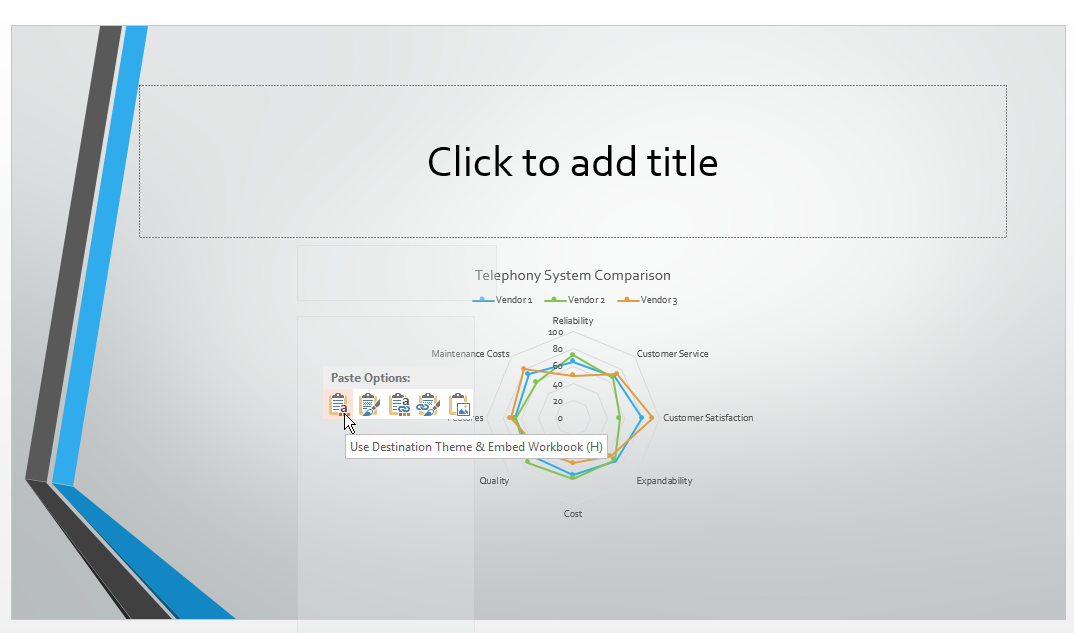
When you right-click to paste your chart into the source document, you are offered several Paste Options in addition to Picture. These options allow you to choose between embedding the chart or linking the chart, and whether or not to use the source formatting or the destination theme’s formatting. Your options are:
- Use Destination Theme & Embed Workbook
- Keep Source Formatting & Embed Workbook
- Use Destination Theme & Link Data
- Keep Source Formatting & Link Data
Use Destination Theme means the paste will adjust your chart’s colors and fonts to match the styles in your destination document. This can be very handy if you are using the same chart in several different reports that have their own look.
Keep Source Formatting will retain the colors and style of the source chart.
Embed Workbook will create a copy of the data and embed it into the destination document. Future changes in the source will not be reflected. You can manually change the chart by double-clicking on it and making changes in the mini-spreadsheet that opens inside the destination document. Changes you make in the destination document will also not affect the source data. Embedding the chart and its source data is useful for sharing documents between viewers and your own computers. However, it can create very large files.
Link Data is what you’ll use if you want the information in the chart or spreadsheet to be automatically updated when the source data is updated. A Link is created to the original and changes to the source will make the changes in the destination document. As the Caution mentions above, if the source file is moved, then the destination document will lose the ability to receive updates.
A basic CTRL+V paste is essentially the Use Destination Theme & Link Data option by default (though you can change this default if you wish).
Most of these options are also available by using Insert Object. But with copy/paste such an easy and flexible method for exporting Excel charts and importing them into other Office documents, you may find that you never use Insert Object again.
