The Pivot Table and Percentage of Total Calculations
Once you learn how to create an Excel PivotTable, you’ll discover that organizing your information is only the first step in getting the most out of this useful feature. PivotTables then give you the ability to further manipulate the organized information. Value Field Settings let you perform different types of summarizations. Calculated Fields and Calculated Items let you build formulas based on PivotTable values. And, when you want a PivotTable to help you see relationships within your data, you can show values in terms of percentage of totals and even percentage of subtotals.
To follow using our example, download Excel pivot table percentage of total.xlsx
Excel PivotTable – Percentage of Total
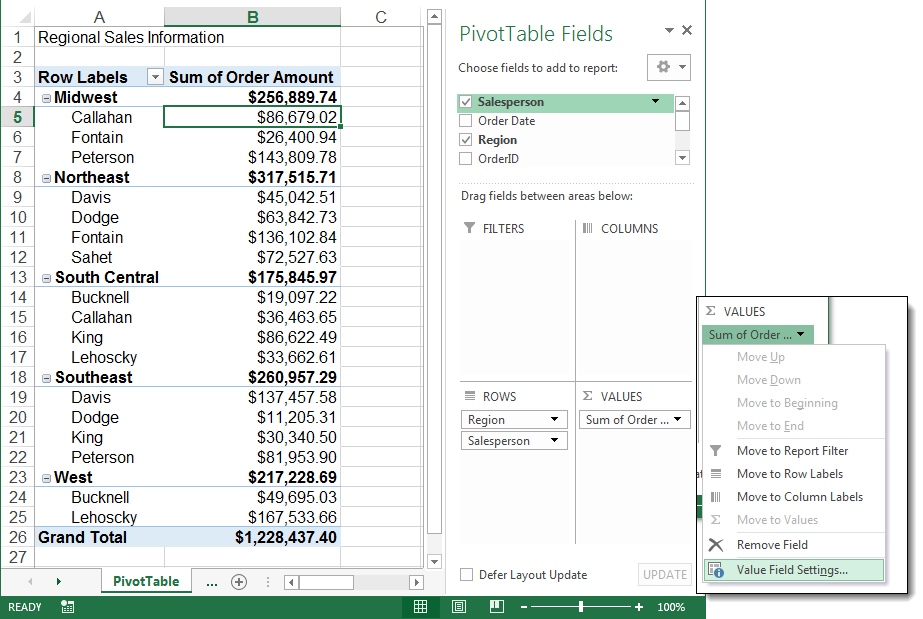
In our example, we have a PivotTable that organizes and summarizes sales data by region and sales person. We would like to see which regions are performing the best, and which salespeople in each region are contributing most to their area. Percentage of Total is a good way to show relationships to a whole.
To show percentage of total in an Excel Pivot Table, create your PivotTable with the information you want summarized, and then follow the steps below. This feature was introduced in Excel 2010, so applies only to 2010 and later versions. Images were taken using Excel 2013 on Windows 7.
Click anywhere in your PivotTable and open the PivotTable Fields pane. In the Values area, select Value Field Settings from the field’s dropdown menu.

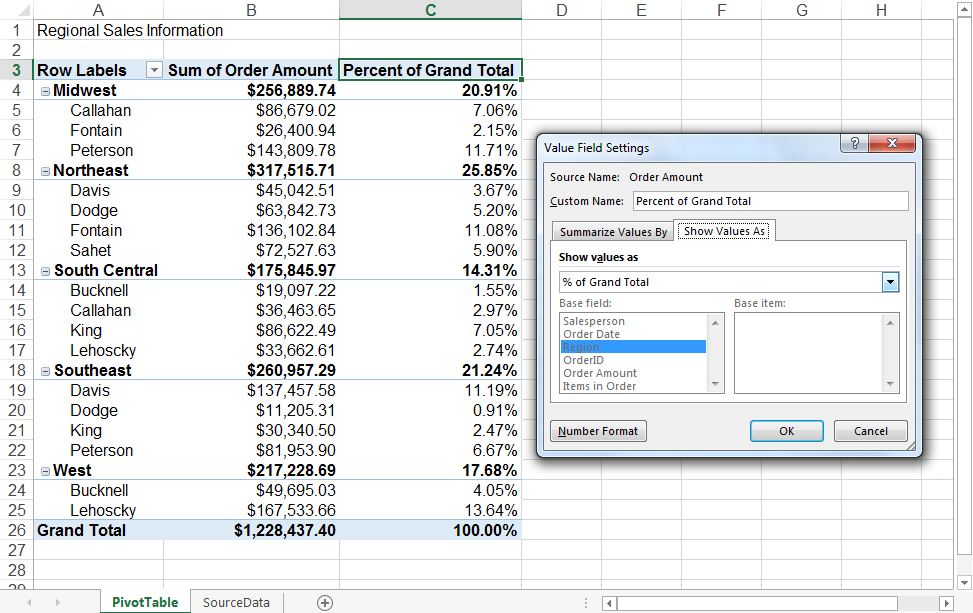
In the Value Field Settings dialog box, select the Show Values As tab. The default is “No Calculation”. But by opening the Show values as dropdown menu, you can see a variety of options for how your totals are displayed.
PivotTable Percentage of Grand Total
Once you select % of Grand Total in the dropdown menu and press OK, your PivotTable values are shown as percentages.
- All Sums are shown in relationship to the Grand Total
- Individual sales person sums are shown as percentage of Grand Total
- Regional totals are shown as percentage of Grand Total and reflect sum of Individual sales people in the region
PivotTable Percentages of Subtotals
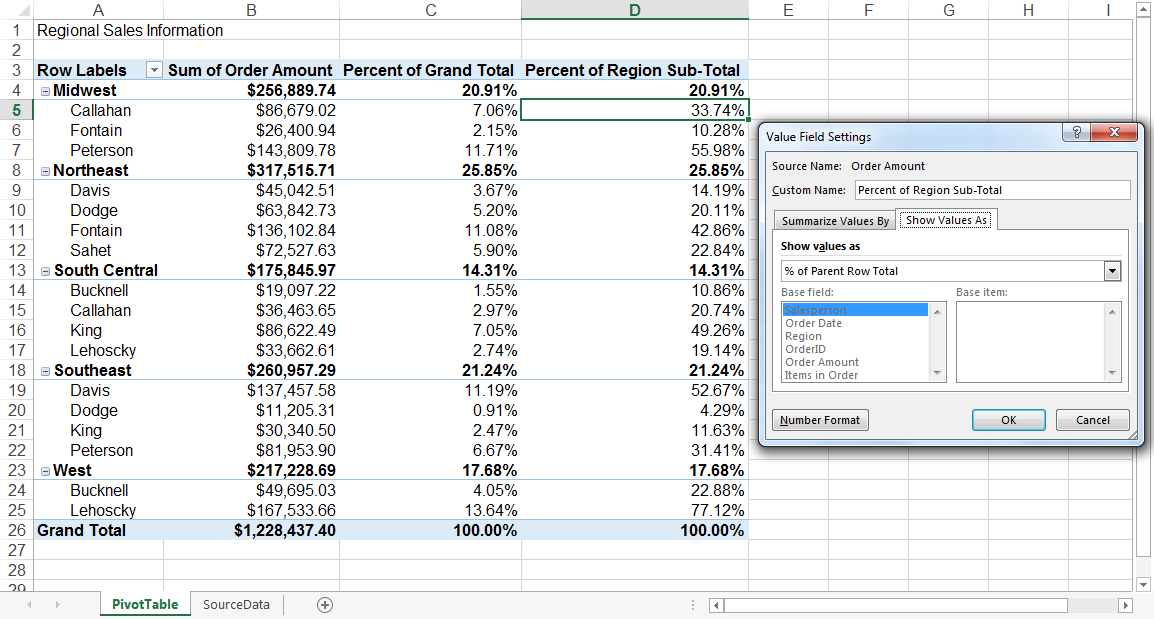
If we want to see percentages of subtotals – such as how well each sales person contributes to their region instead of the Grand Total, we’ll use the % of Parent Row Total values option.
- Regional sums are shown as percentage of Grand Total
- Individual salesperson sums are shown as percentage of Region
With this analysis, you can quickly see that the Northeast region is the top performer, as it contributes the biggest percentage to the bottom line. We can also see that Lehoscky is the top sales person overall and in the West region, but comes in only 3rd in the South Central region.
Custom PivotTable Percentage
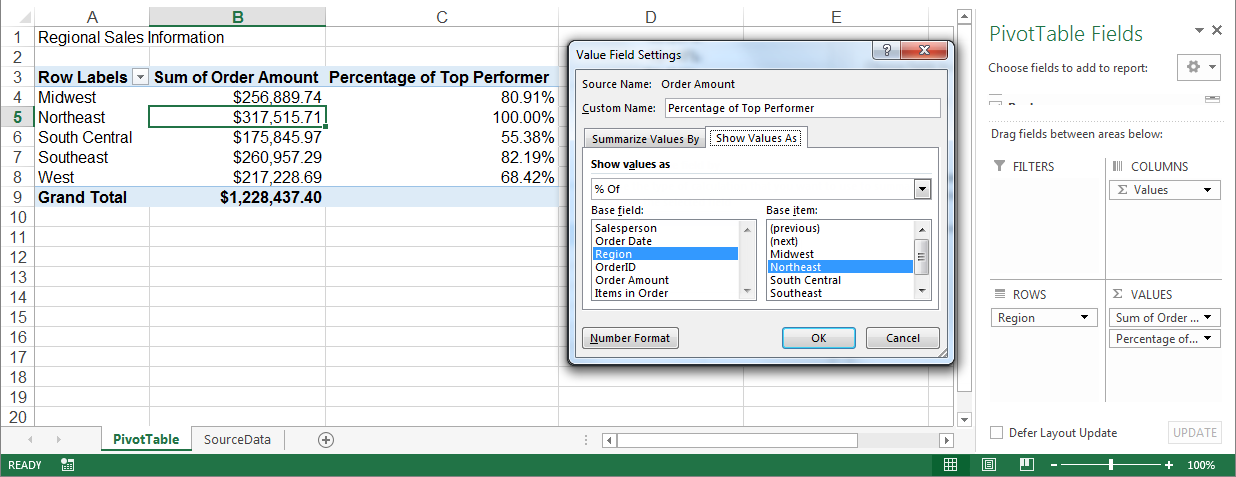
Finally, PivotTables let you create your own methods of comparison: By setting the Top Performing Northeast region as our Base item and using the % of option, we can see how well the other regions are doing as a percentage of the Northeast’s performance.
The “show values as” percent features can save you a lot of time by letting you skip having to create complicated formulas or PivotTable calculated items by hand.


