Use Sparklines to Display Trends in Excel
- Author: Excel Tips and Tricks from Pryor.com
- Categories:
- Tags:
- Share on:
A sparkline is a tiny chart in the background of a cell. When you use a sparkline, you can easily see the relationships between it and its underlying data. And, you can copy sparklines to adjacent cells by using the Fill Handle. Sparklines are printed as-is when you print a worksheet that contains them, unlike charts that may require special print handling.
Insert a Sparkline
- Select the cells that contain the data you want in the sparkline chart.
- Select the type of sparkline you want from the Sparklines group [A] on the Insert tab.
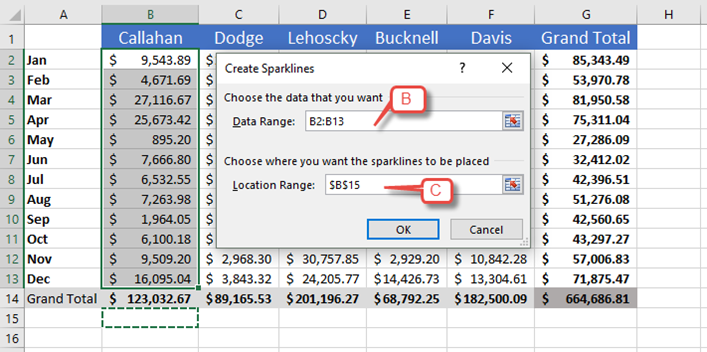
- In the Create Sparklines dialog box, the cell or range you have selected will be filled in the Data Range: text box [B].
- Type where you want your sparkline to go in the Location Range text box [C], or click the destination cell. A selection box will appear around it.
- Click the OK button.
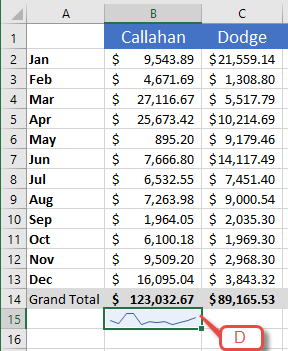
- The sparkline will appear in the position you designated [D] and the Sparkline Tools highlighted ribbon [E] will become available when the cell is selected.
- Copy the sparkline to additional rows or columns using the Fill Handle.
- Select the sparkline you want to copy, then hover over the Fill Handle until your curser turns to a cross [F].
- Drag the handle over the cells you want to fill. Sparklines will appear in each of the cells [G].
Pro Tip: Use the Quick Analysis tool to quickly add a sparkline to your data.
Choose a Seminar and Save $10
Microsoft® Excel® 2013: Beyond the Basics
1 Day
- CEU: 0.6
- CPE: 6
Team Training - Virtual or In-person

Microsoft® Excel® Basics
1 Day
- CEU: 0.6
- CPE: 6
- PDU: 6
Virtual Seminars:
-
Apr 29
-
Apr 30
-
May 1
-
+ 35 more dates


